
01 Position
Where it
lands
A refinery, a moulding plant, a trawler fleet and a sand-washing operation all carry real environmental and safety exposure. Treating that as a communications exercise would be dishonest.
Our position is narrower and more practical: manage effluent and emissions to standard at every site, run genuine safety systems rather than paper ones, harvest within quota, and put community investment where we physically operate rather than where it is most visible.
Progress is measured against the same indicators every year and reported in the annual accounts, whether the numbers improved or not.
02 Focus areas
01
Effluent & emissions
Treatment to Department of Environment standard at every processing site, with discharge monitoring and quarterly independent sampling.
02
Occupational safety
Documented safe systems of work, mandatory protective equipment, blame-free incident reporting and investigation of near misses.
03
Responsible harvesting
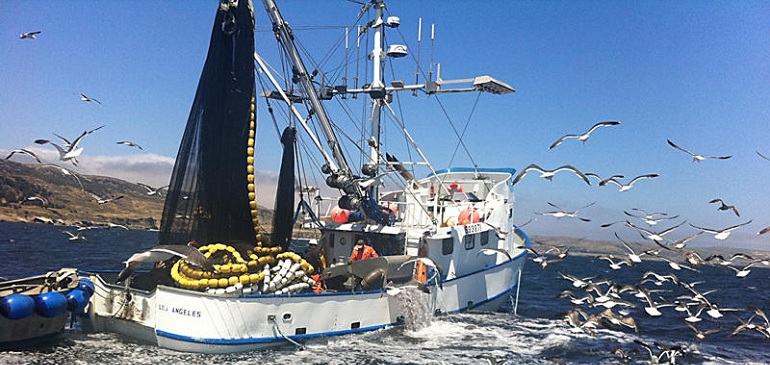
Fishing within licensed quota and every closed season, with by-catch handling and gear standards applied across the fleet.
04
Material circularity
Regrind and reuse in polymer processing, waste segregation on site, and recovery of process solvents where technically possible.
05
Energy intensity
Energy per unit of output measured at each plant, with reduction targets set annually rather than announced once.
06
Community investment
Education, healthcare access and skills training concentrated in Narayanganj, Gazipur, Chattogram and Sylhet, where our sites and vessels are based.
03 National contribution
Development,
measured plainly
The most useful thing an industrial enterprise can do for a developing economy is make locally what the country currently buys abroad, employ people formally to do it, and pay tax on the result.
That is the frame we use. It does not replace environmental responsibility — it sits alongside it.
| Indicator | 2024 | 2025 |
|---|---|---|
| People employed | 3,208 | 3,412 |
| Apprenticeships completed | 151 | 184 |
| Lost-time injury rate | 1.42 | 0.96 |
| Effluent compliance | 98.1% | 99.4% |
Injury rate per million hours worked. Effluent compliance measured against Department of Environment discharge limits.
04 Community
Programmes
we fund
Four standing commitments, funded from a fixed annual allocation rather than from whatever is left over.